Combined Skills
Lab Materials
Download this: Landsat 8 Image
Lab Content
Objective
Students will create a composite, subset, reclassify and analyze.
Procedure
- Open ArcMap
- Start a new blank Map Document
- Navigate to your data folder for this lab and add LC80190362015257LGN00_B5.TIF to the map. Lake Sydney Lanier and Gainesville are on the far left edge of the image. This image is the data for band five of a single Landsat tile.
- Landsat 8 has a new set of sensors that are somewhat different from what was available on Landsat 7. Take some time to review the bands and what regions of the electromagnetic spectrum they correspond to. Landsat 8 on wikipedia.
- Remote sensing data is often distributed in the format that your Landsat data for this exercise is in. Each band of the data is stored in a separate file. In order to use the data in the typical manner in most geospatial software packages you will need to combine the individual bands, the individual files, in to a single file. We will look at the process for layer stacking, also known as compositing images, in both ArcMap and Erdas Imagine.
Compositing Images with ArcMap
Open ArcMap
Start a new blank Map Document
Use the search functionality to find and open the Composite Bands tool.
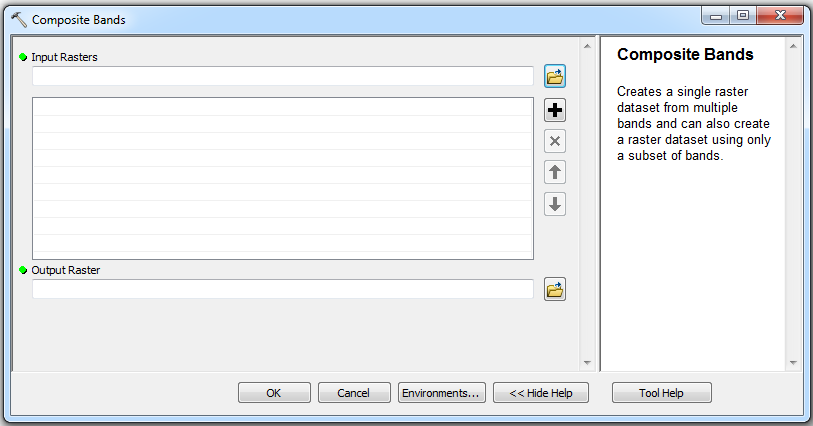
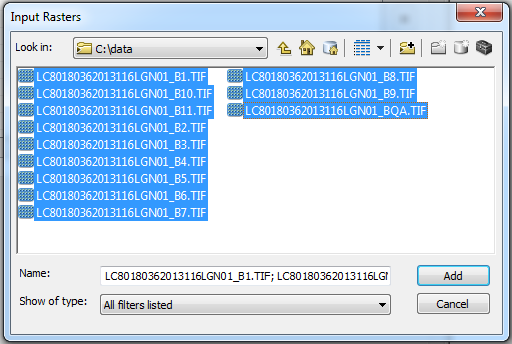
Select the input rasters for the tool. Navigate to your data folder and select all of the bands of your image and click add.
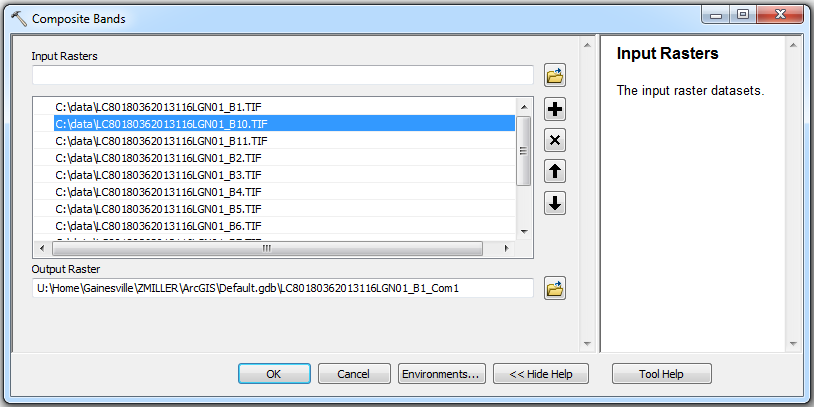
The order of the layers in the raster list list is important. You need to ensure that the order of the layers matches the order of the landsat sensor bands. Use the up and down arrows to reposition the layers in the proper order.
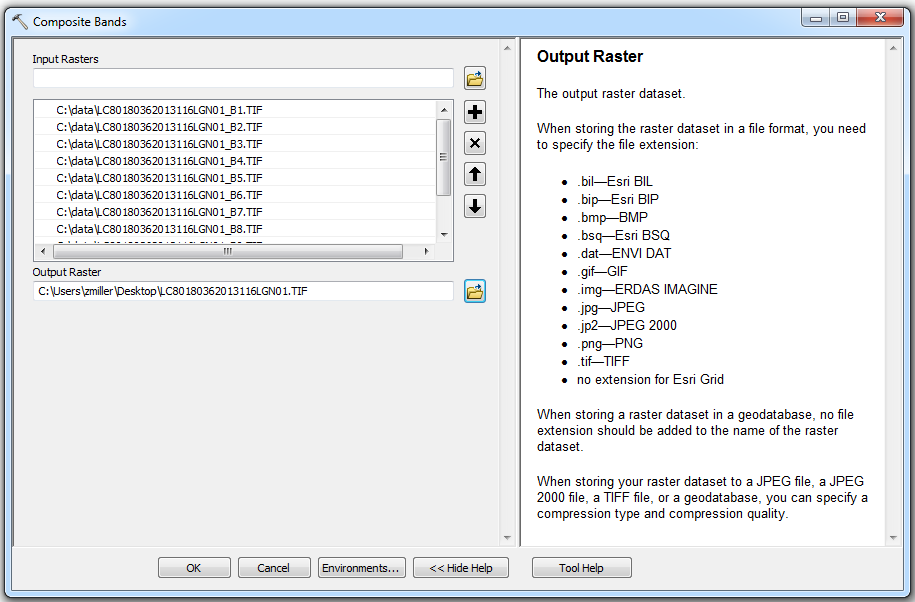
Specify the output location and type of the composite image. Take some time to review the tool help for the output option to better understand the output file types that are available and what type of file you will get if you specify an output file name but you do not give it a file type extension.
Open the resulting image and review it in ArcMap. What is the proper band combination for viewing the image in False Color?
Creating A Subset Image In ArcMap
Pull up the image LC80180362013116LGN01 that you created for the Compositing Images lab into ArcMap. Right click on the image in the table of contents and click properties and then source to get the coordinate/projection info of the image.
Pull up the HUC12 watershed boundary shapefile, HUC12_031300010305.shp, from the LabMaterials folder. Right click on the shapefile in the table of contents and click properties and then source to get the coordinate/projection info of the layer.
Make sure that the image to be subset, and the shape file to be used for the ‘cookie cut’ have the same projection and datum. If not, use ArcTools to reproject the shapefile to the same projection as the image.
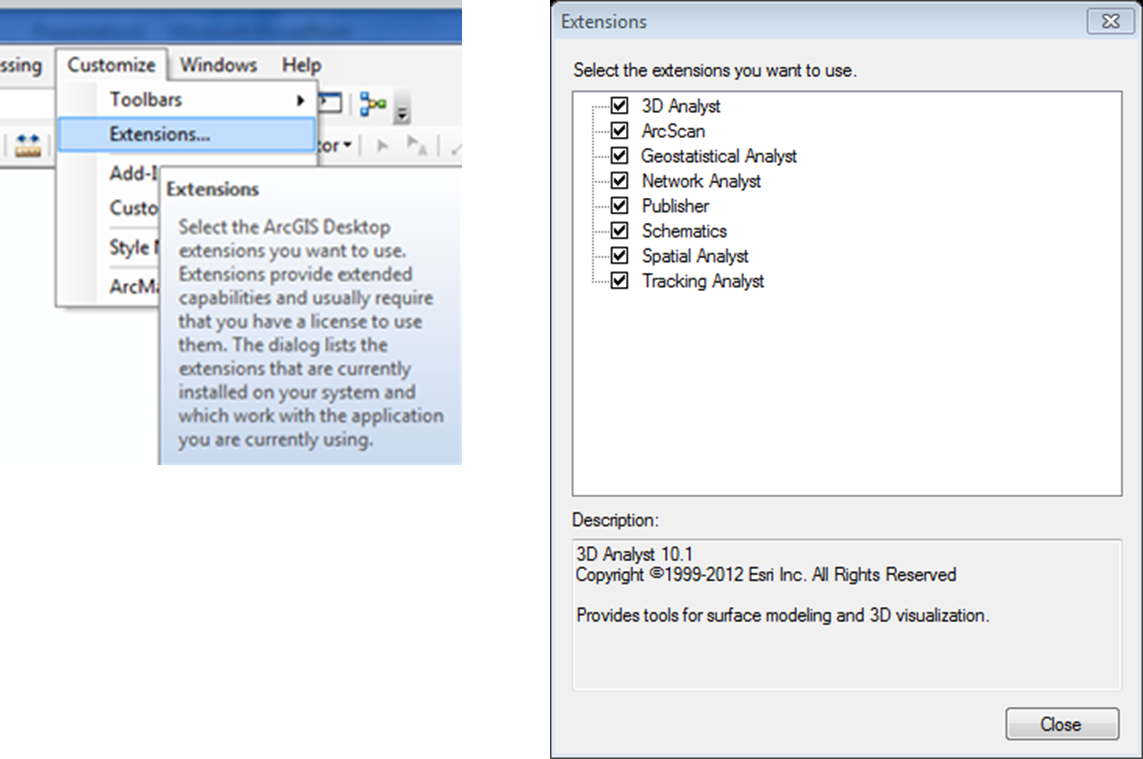
Before we can clip the image we have to make sure that the spatial analyst toolbar is turned on. To do this you have to click on the Customize tab and then extensions. Check all of the boxes here so you do not have to worry about running into any issues.
Use the search functionality to find and open the Clip (Data Management) tool.
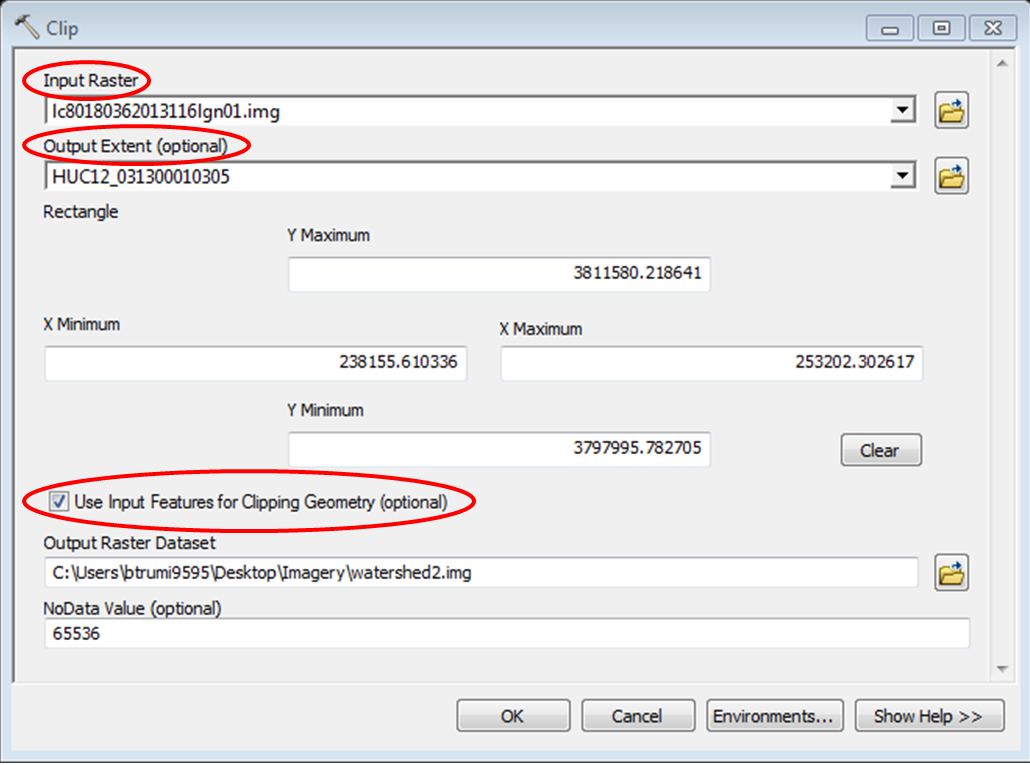
Set the inputs on the tool and make sure they match the highlighted sections in the picture below. To learn more about what each option does click the Show Help button and as you click on the different elements of the tool it will explain what each one is. Save the output File as watershed2.img.
Open up one of your subset images in ArcMap and do a map composition. It should look similar to the MossyCreek.PDF document in the LabMaterials Folder you downloaded.
Downloading and Preparing Additional Data
- Visit the Multi-Resolution Land Characterstics Consortium and download the National Land Cover Database (NLCD) data for 2001, 2006 and 2011.
- Clip the 2001, 2006 and 2011 data with the HUC 12 boundary. Be sure to clearly name your output files.
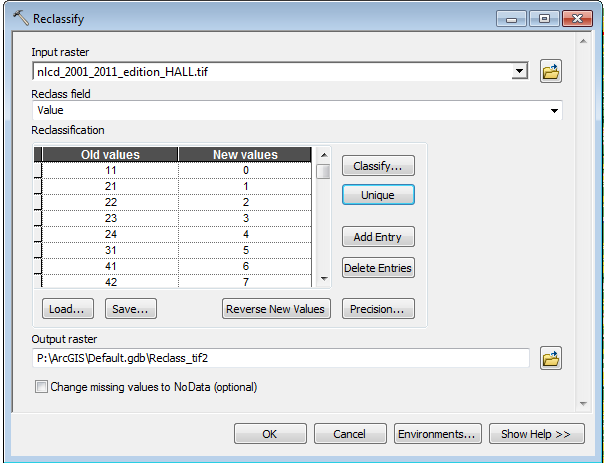
Reclassifying and Tabulating
The NLCD classifies landcover into several detailed landcover categories. You can consult the legend here. In future labs we will learn how to create landcover data from Landsat images. Our processes will produce a simpler set of landcover classes: Forest, Water, URS and Pasture
In order to compare our landcover data to the NLCD data we will need to reclassify the NLCD data to match our simpler set of four classes. Reclassifing is creating a mapping from the NLCD landcover values to our landcover classes. For example we may map the three NLCD forest classes, 41, 42 and 43 to a single forest class that we assign a value of one.