
Edward
L. Green, Ph.D.
Mathematics Department
University of North Georgia
(706) 864-1809 egreen@ung.edu
Research Article:
Model of a solar system in conservative geometry
Research Article:
A framework for creating galaxy models in the geometry of the
conservation group
What
kind of careers are available for Math majors? Careers in Mathematics
Want To MAJOR in Mathematics? Dual Degree is
Mathematics/Engineering?
****
CHECK OUT
the degree requirements for a B.S. in
Mathematics
or Math/Engineering Dual Degree
Requirements
Info on Dual Degree: Dual Degree Instructions
Nonlinear Dynamics and Chaos
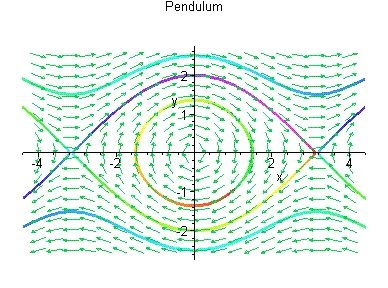 The graph shows the phase portrait for a pendulum with
no damping. The differential equation is
The graph shows the phase portrait for a pendulum with
no damping. The differential equation is  . The vertical
axis represents the angular velocity:
. The vertical
axis represents the angular velocity: ![]() and the horizontal axis represents
theta. The inside loop corresponds to the pendulum bob rocking back and
forth in a periodic motion. The largest closed loop corresponds to the
pendulum bob being raised to the top (
and the horizontal axis represents
theta. The inside loop corresponds to the pendulum bob rocking back and
forth in a periodic motion. The largest closed loop corresponds to the
pendulum bob being raised to the top ( ![]() ) and then given a
slight displacement to the right, the pendulum bob swings back and forth, but
very slowly near
) and then given a
slight displacement to the right, the pendulum bob swings back and forth, but
very slowly near ![]() or
or ![]() . The curve at
the top represents the situation where the pendulum bob is given a large
positive velocity. Thereafter the bob will swing through the bottom point
but with enough velocity so that it goes over the top and repeats this motion
indefinitely. This is one example of an application that is studied
in the Nonlinear Dynamics and Chaos course (Math 3020).
. The curve at
the top represents the situation where the pendulum bob is given a large
positive velocity. Thereafter the bob will swing through the bottom point
but with enough velocity so that it goes over the top and repeats this motion
indefinitely. This is one example of an application that is studied
in the Nonlinear Dynamics and Chaos course (Math 3020).
Links to websites for mathematics, research, and other favorites:
1) American Mathematical Society: http://www.ams.org
2) American Physical Society: http://www.aps.org
3) Swiss Tourism.
COMPLEX ANALYSIS EXAMPLE: The graph shown illustrates constant
temperature curves which are
determined via a function of complex variables. The steady-state
temperature is zero on the x axis and 100
on the union of two rays which meet at the point (0,pi) at an angle of 90
degrees.
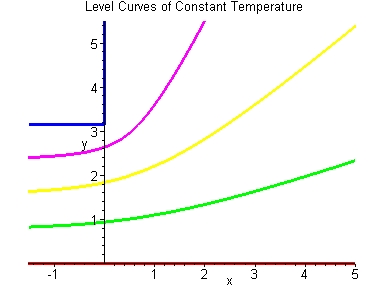
The other curves illustrate the lines of constant temperature for
temperatures of 25 (green), 50 (yellow)
and 75 degrees (purple)..
Disclaimer
This page is not a publication of the University of North Georgia (UNG) and UNG
has not edited or examined the content of this page.
The author of each web page is responsible for the content of the page and for
ensuring that proper permissions have been obtained to use graphics images and
other materials.
If there is reason to believe that something has been used without permission,
please contact the author of the page(s).