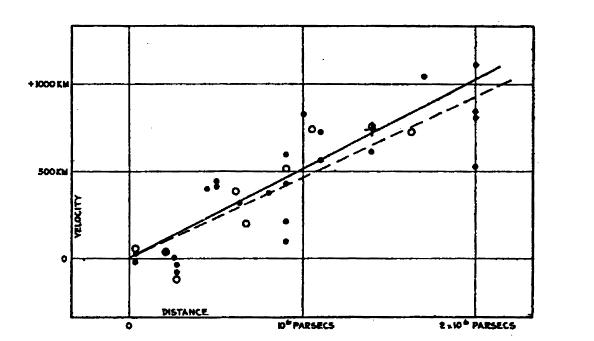
Figure 1. Hubble's original Hubble Diagram. Note that the galaxy cluster with the maximum distance is 2 Mpc. The value of the Hubble Constant was around 500 km/s/Mpc, much larger than current estimates.
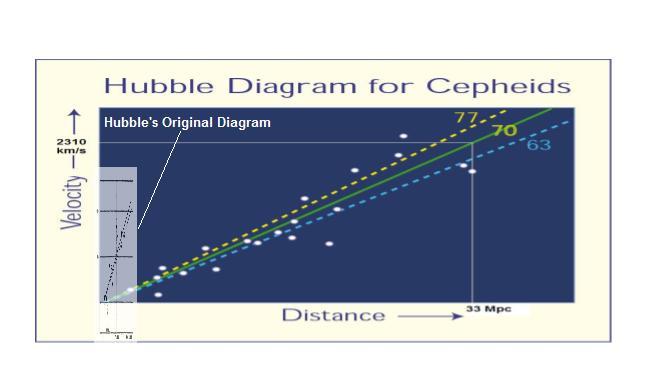
Figure 2. Hubble Diagram derived from the Hubble Space Telescope Hubble's Constant Project. The value of the Hubble Constant was found to be 70 km/s/Mpc +/- 10 km/s/Mpc. Note the extent of Hubble's original diagram (Figure 1) compared to the HST Hubble Project diagram. (See small light rectangle in the lower left corner.) Note also the much higher slope (Hubble constant) that Hubble measured.

Figure 3. Hubble diagram from the Hubble Diagram Lab with the HST Hubble's Constant Project diagram superimposed. Note that the distance measurements for the lab are based on previously calibrated "standard candles" and give a slightly high value for the Hubble Constant. This diagram shows the nominal distances measurable before the Cepheid calibration of the SN-Ia standard candle by the HST. The red line indicates the Hubble Telescope derived H = 70 km/s/Mpc.

Figure 4. Extended Hubble Diagram using SN-Ia distances to galaxy clusters. The best-fit model is the Flat Dark Energy Model (assuming no supernova evolution) which requires a non-zero cosmological constant and a Universe that is accelerating in its expansion. Note the extent of the Hubble Lab Hubble Diagram (Figure 3) on this extended Hubble Diagram. The original Hubble Diagram (Figure 1) would be no more than the size of the period at the end of this sentence and would be located at the lower left corner of the superimposed lab diagram.