eCognition Segmentation and Supervised Classification
Lab Materials
Download this:
Lab Content
Equations
Objective
Students will use eCognition to produce a supervised classified map based on Object Based Image Analysis.
Procedure
eCognition Segmentation
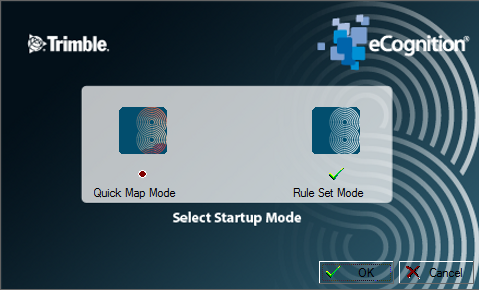
Open up eCognition and make sure you set it to Rule Set Mode before the program fully opens.
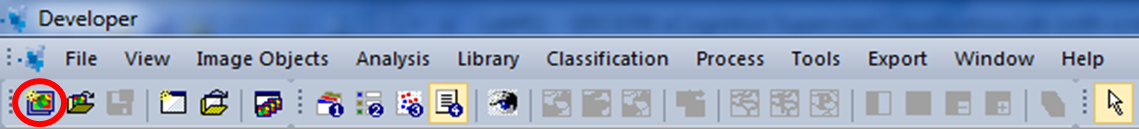
Click on the ‘Create New Project’ icon, which is located in the upper left hand corner of the screen or by File –> New Project and two new windows will open up.
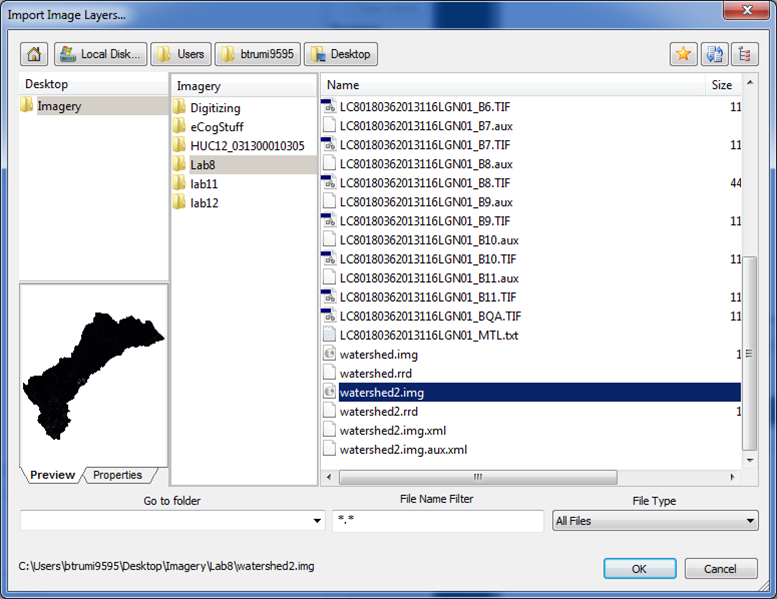
The first window is to select the image that will be used. We will be using ‘watershed.img’ from the previous lab then click OK.
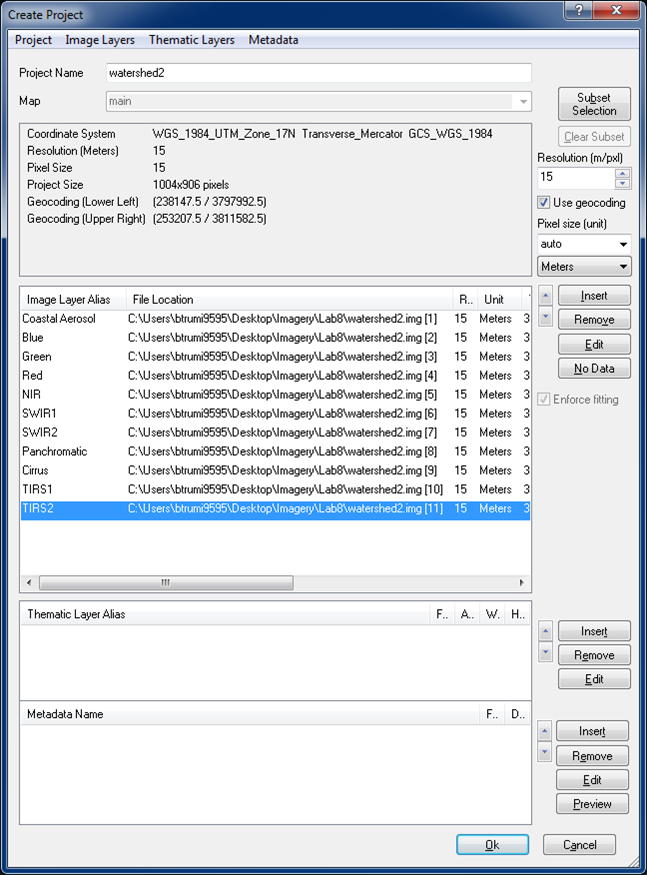
The next window is where the alias for the layers to recognizable names i.e. Layer 1 should be renamed Coastal aerosol, Layer 2 renamed as Blue, etc... Check here http://landsat.usgs.gov/band_designations_landsat_satellites.php if you need refreshing. Then click ok
Now the image has appeared in the main viewer
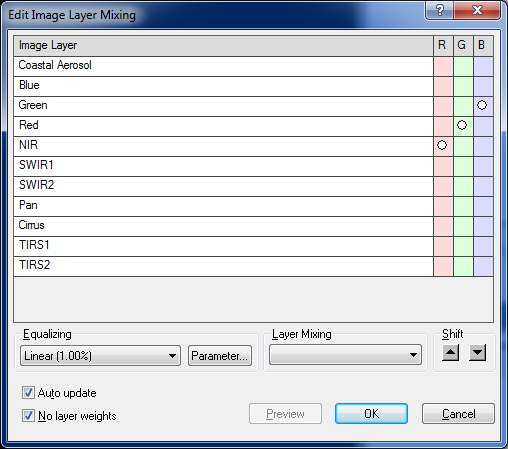
Click on Edit Image Layer Mixing located that the top of the screen.
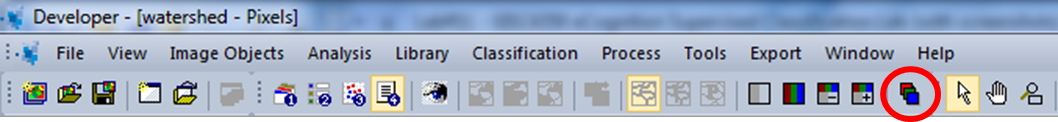
Change the setting from true color to false color and click OK.
Click on the Develop Rulesets button located at the top of the screen; new windows will open on the right side of the screen: Process Tree, Class Hierarchy, Image Object Information, and Feature View.
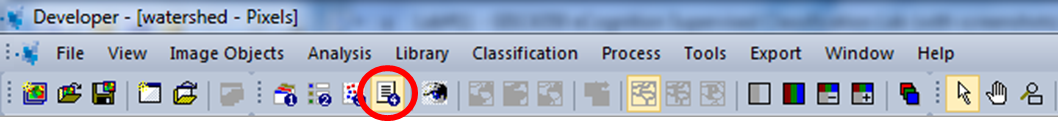
Right click in the Process Tree and click on Append New; in the drop down for Algorithm select multiresolution segmentation then click Execute.
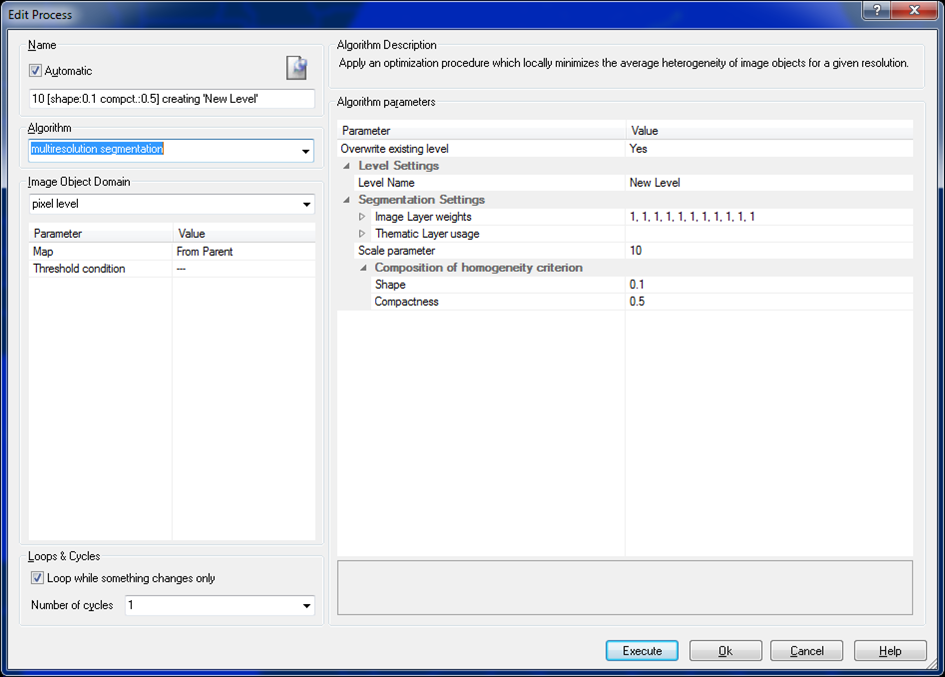
Perform at least six segmentations with varying scale, shape and compactness parameters. Start with Scale Parameter = 100, Shape = 0.1 and Compactness = 0.5
Continue decreasing the Scale Parameter by 10 and note that the object sizes get smaller until you come to the optimal scale i.e. the objects begin to be representative of real objects on the ground so that urban areas, vegetated areas, and water bodies begin to form distinct objects.
Make sure to take screen shots of the first and last segmentation; state what parameters you used for the final segmentation and attach them in your report. Once finished use the last segmentation you preformed and follow the remaining steps.
eCognition Classification
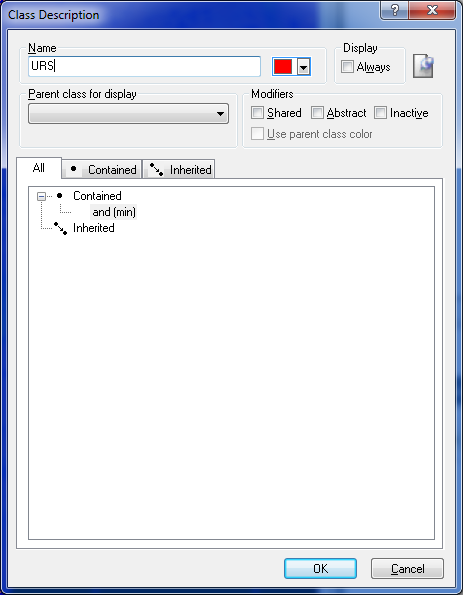
Right click inside the Class Hierarchy box and select Insert Class.
Type Urban into the box for Name and change the box for selecting colors to red, then click OK.
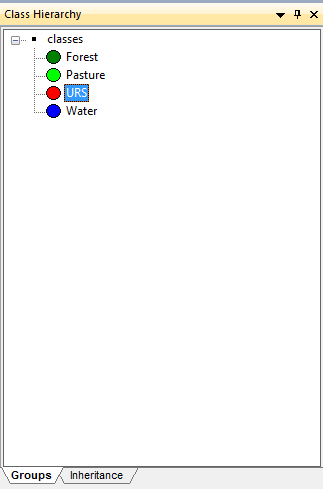
Repeat these steps for Forest, Pasture, and Water and make sure that you label and give the appropriate colors to class.
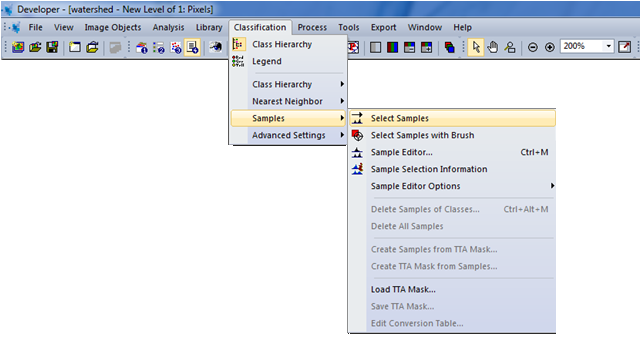
On the toolbar go to Classification –> Samples –> Select Samples.
Go to the Class Hierarchy box and click on Urban and make sure it is highlighted. This makes sure that your selections go to that class.
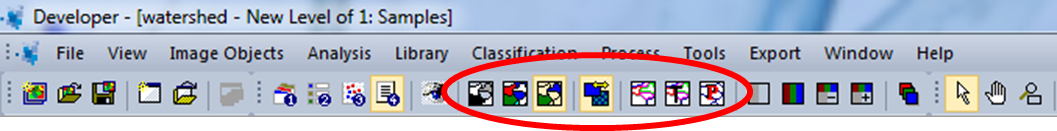
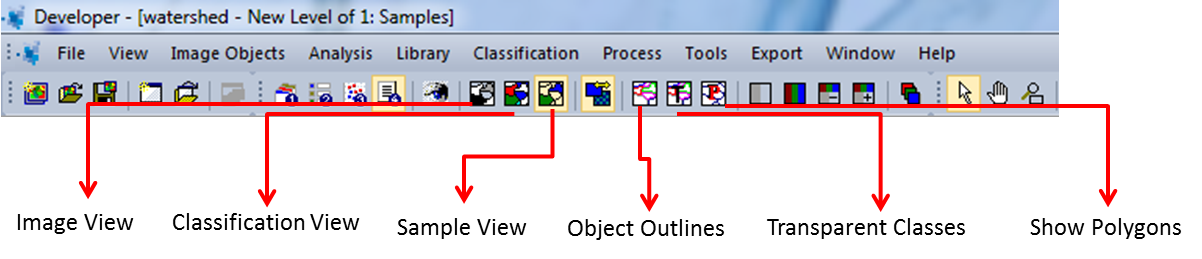
Zoom down to an area that is urban and double click inside the segments that overlay urban areas or hold the shift key and click once in the segment. This will turn the segment to the color of the class that is selected. To make it easier to figure out what is what play with the buttons shown in the image below.
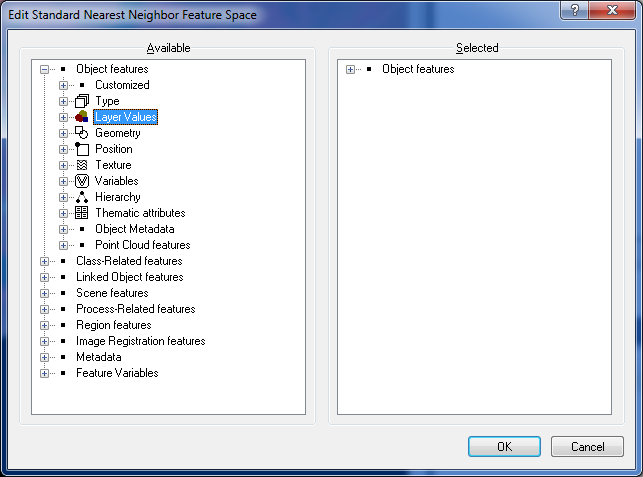
Select at least 10 samples for each class. Remember to select the class in the class hierarchy before selecting the samples for it. Once finished with selecting samples go back up to Classification –> Nearest Neighbor –> Edit Standard NN Feature Space. Open up ‘Object features’ and double click on ‘Layer Values’ and then click on OK.
Go back to Nearest Neighbor and select Apply Standard NN to Classes. Click the All—>> button then click Ok.
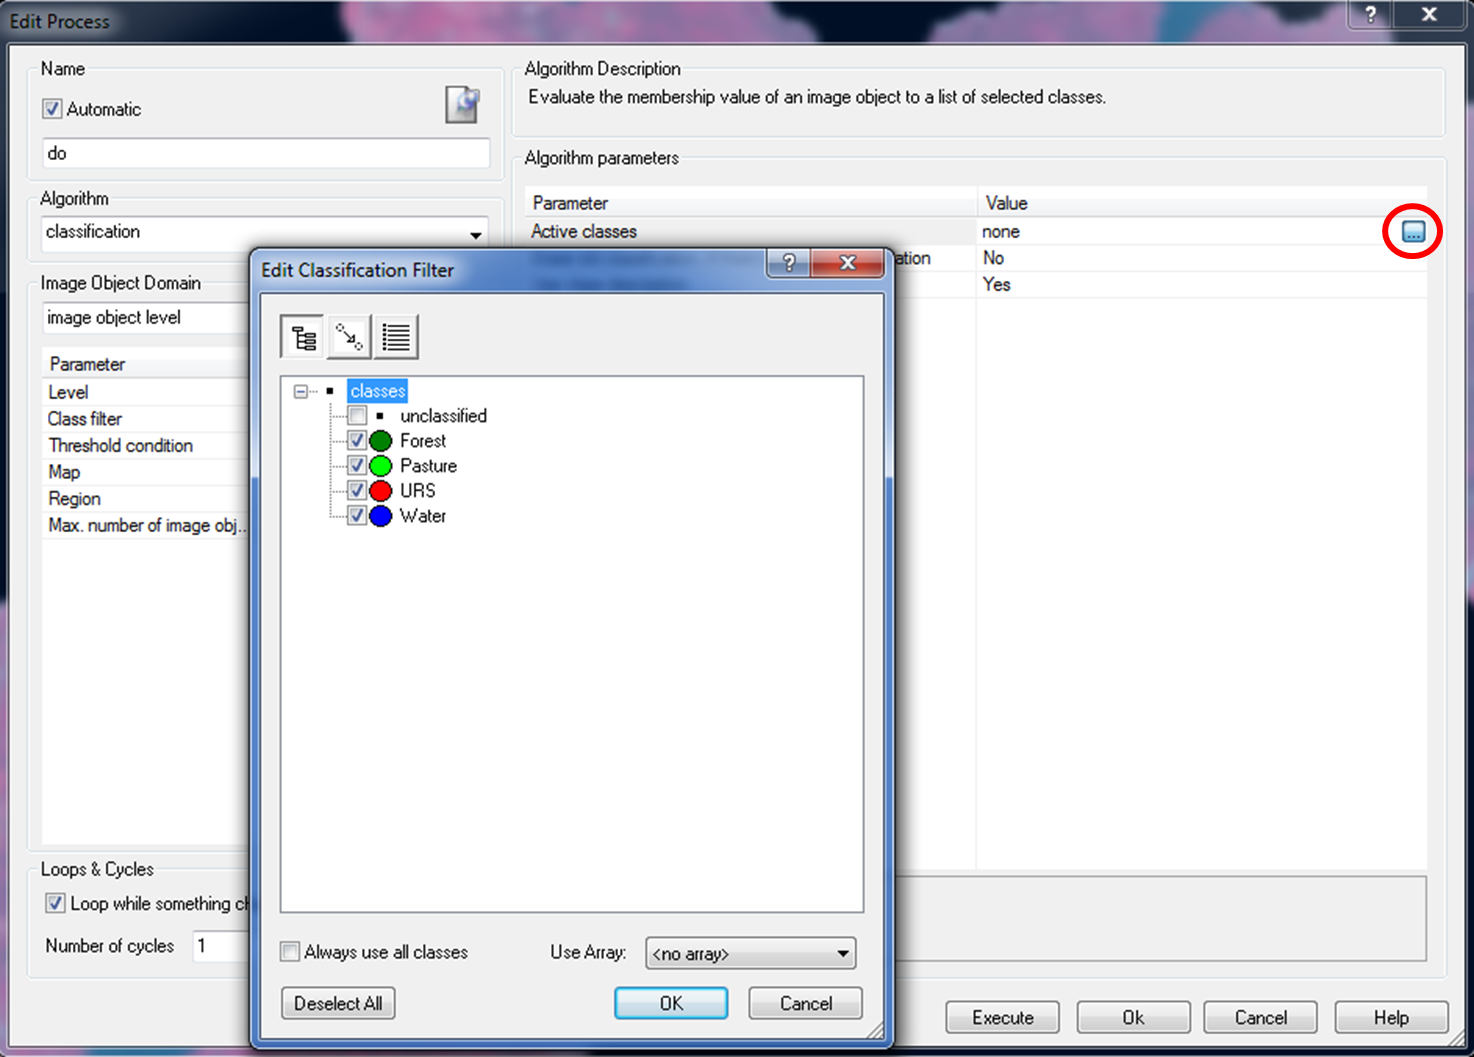
Right click in the Process Tree box and click on Append New; for the Algorithm drop down menu select classification. Then for Active classes under change the None by clicking in the box then on the three dots or double clicking on the field and make sure that every class besides Unclassified has a check in it and click Execute.
Before the results are exported they need to be reviewed to make sure that everything worked correctly; to do this we are going to experiment with the visualization options. View the following image for details on what each button does. Be sure to view your classification by clicking the Classification View button.
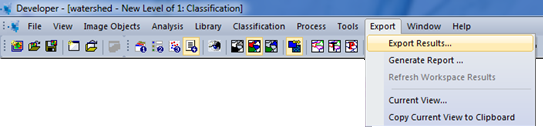
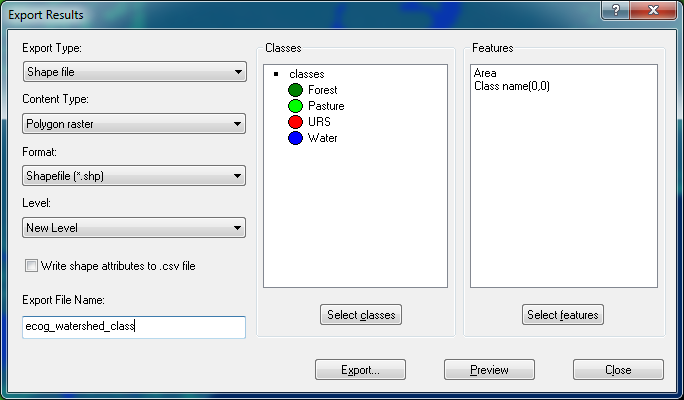
Now export the results by clicking on Export –> Export Results.
Leave the buttons to the left default; change the Export File Name to ‘eCog_Watershed_SupClass’. Click on Select Classes and select all except for unclassified then click OK.
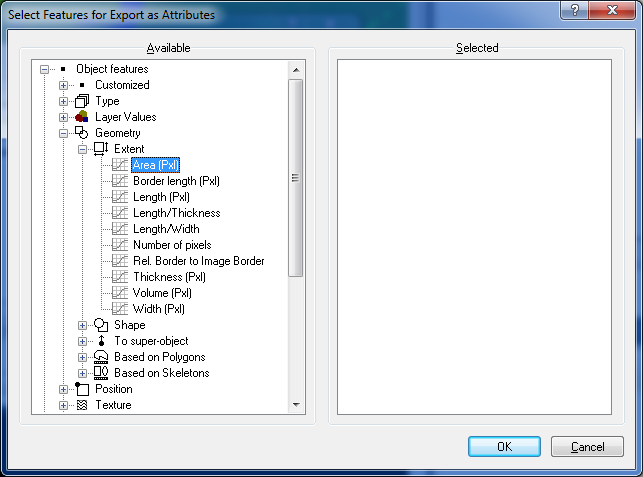
Click on Select Features to add all the attributes. The first feature you want to add to the attribute table is the area of each class. Follow this path to add the area: Object Features –> Geometry –> Extent –> Area and then double click on Area to add it to the space to the right. Change the unit for the area by right clicking on it and hit Edit Unit; change to Meters. This keeps from having to calculate the area from pixels in ArcMap.
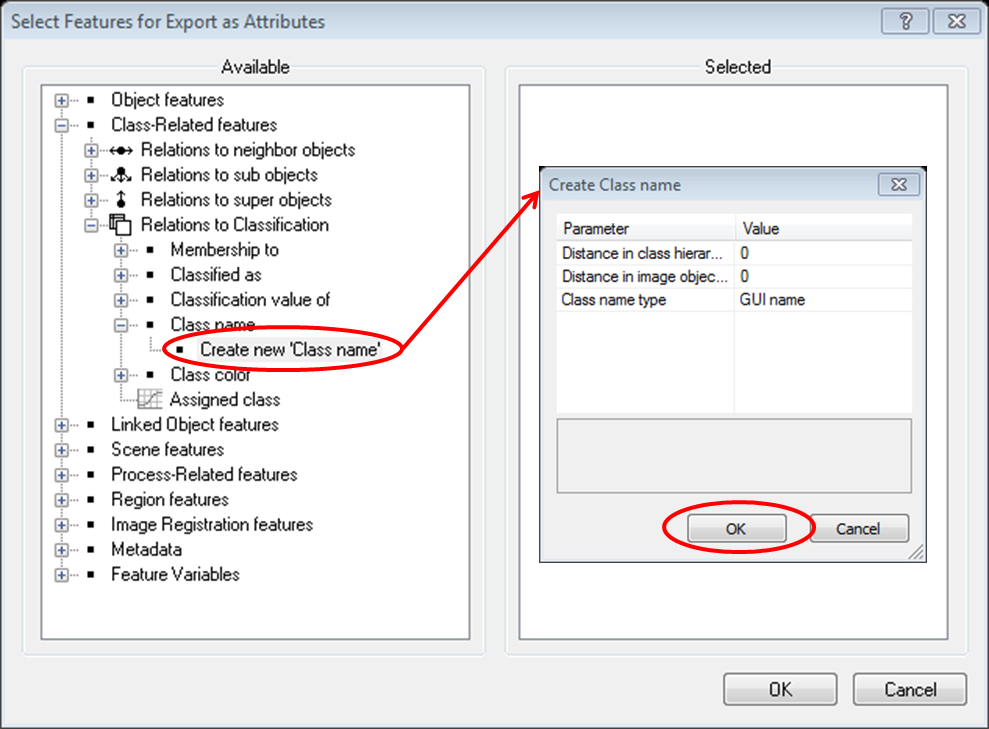
The second feature you want to add to the attribute table is class name. Follow this path to add the name: Class-Related features –> Relations to Classification –> Class name and double click on Create new Class Name and in the new window click OK. This will add it to the selected box.
Click Ok to close the Feature Select window, make sure your window matches the image below and then click Export.
Open the newly created shapefile in ArcMap and do a map composition to include in the lab report.
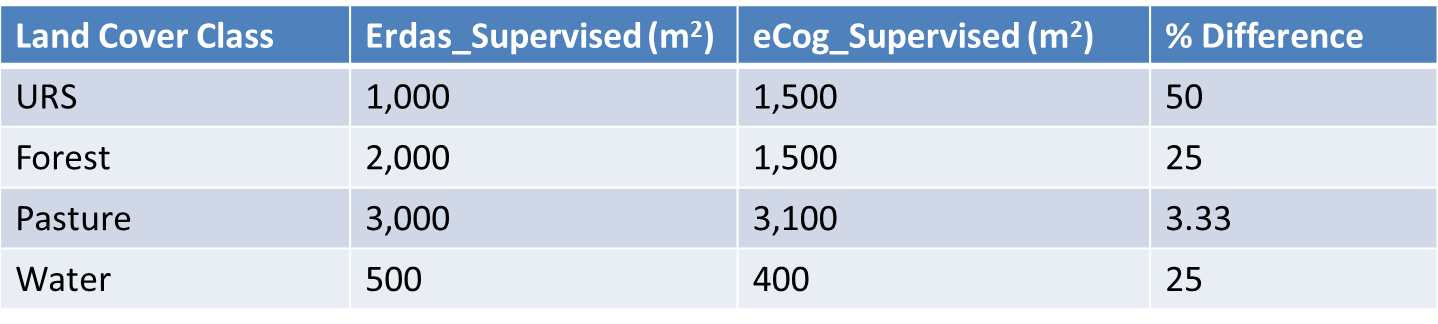
Make sure to compare the supervised classification from this lab with the one from ERDAS Imagine and provide map compositions of both. Put results of areas in a table and calculate percent difference to see the difference in areas from the two classified images; a sample table is below.
Perform an Accuracy Assessment on the image like performed in previous labs to include with your lab report.
Write up a full lab report on this lab.